
Last December, the World Intellectual Property Organization (WIPO) published an essential document: the World Intellectual Property Indicators 2020. The Report provides an integral and in-depth account of global trends in connection with registration, grant, validity and economic sectors, among others, linked to patents, utility models, trademarks, industrial designs, geographical indications, plant varieties and creative industry.
This information is worth its weight in gold for different stakeholders, because it allows specific trends to be identified such as the economic sectors with the highest technological growth, the countries in which most investments are being made or the most efficient intellectual property offices. The WIPI Report 2020 compares progress in various intellectual property indicators in 2018 compared to 2019, i.e., pre-COVID-19, so decreases or slowdowns in figures with respect to 2020 are to be expected.
The key global figures
These are the key figures of the WIPI Indicators Report 2020 worldwide:
- Patents: applications decreased by 3% (2018: ), which is explained by the drop in applications by Chinese residents due to recent regulatory changes. However, if China is excluded from the calculation, the global increase is 2.3%, which is the highest in years. Nonetheless, China represented 43.4% of the total number of applications worldwide.
- Utility models: applications increased solidly by 9.1% (2018: 2,146,600 vs 2019: 2,341,180) thanks to China which grew by 9.5% and represents the impressive figure of 96.9% of the total applications worldwide, followed at a long distance by Germany with 0.5% of the total worldwide, which dropped by 5.2% in 2019.
- Trademarks: applications grew by 5.9% (2018: 14,314,000 vs 2019: 15,153,700), largely due to China which increased by 6.4% and which represents 51.7% of the total worldwide, followed by USA which despite a 5.1% increase, only accounts for 4.4% of the total worldwide;
- Industrial designs: applications increased slightly by 1.3% (2018: 1,343,800 vs 2019: 1,360,900), this time helped mainly by a 4.4% growth in the European Union Intellectual Property Office (EUIPO) and, to a lesser degree by South Korea, which increased by 1.5%, and China, with 0.4%, which despite this, represented 52.3% of the total worldwide.
The Top 5 worldwide and Latin America
The WIPI Report 2020 ranking on filing activity by number of applications worldwide, including resident and abroad, clearly reveals the concentration in filing activity in certain countries. Bearing in mind the Top 5, just with respect to patents, trademarks and industrial designs, as the most common forms of intellectual property, the results are the following:
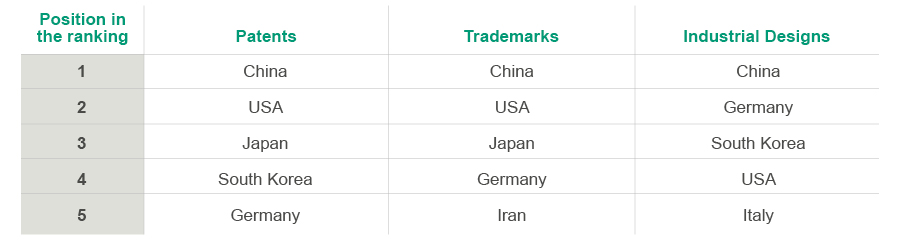
Table: Prepared in-house based on the WIPI Report 2020
The most significant aspect at first glance is the Chinese leadership, as well as the fact that the top 15 positions on the ranking are held by just 7 countries, of which 5 are the leaders in these fields (China, USA, Japan, South Korea and Germany). The fact that Iran is the fifth in the worldwide ranking in trademark filing activity in 2019 is also striking.
Ibero-America deserves a special mention, where Spain is clearly in the top position (no. 23 in patents, no. 17 in trademarks, no. 11 in designs), followed by Brazil (no. 24 in patents, no. 12 in trademarks, no. 20 in designs), Mexico (no. 32 in patents, no. 18 in trademarks, no. 38 in designs), Portugal (no. 37 in patents, no. 30 in trademarks, no. 27 in designs), Argentina (no. 50 in patents, no. 22 in trademarks, no. 45 in designs), Chile (no. 40 in patents, no. 32 in trademarks, no. 76 in designs), Colombia (no. 54 in patents, no. 36 in trademarks, no. 60 in designs) and Peru (no. 77 in patents, no. 37 in trademarks, no. 79 in designs).
Situation of patents 2019
We have seen that according to the WIPI Report 2020, patent applications dropped by 3% worldwide, due to a reduction of -9.2% in China. However, the truth is that China has jumped from 17% of the total worldwide in 2009 to 43.7% in 2019, heading the patents ranking in the last 11 years. The biggest growth in 2019 was in South Korea (4.3%), the European Patents Office (EPO) and the USA (both by 4.1%).
A very interesting breakdown made in this report is the differentiation between “resident” and “non-resident” applications, since it allows the influence of economic agents in the country to be measured and, in particular, the use they make of the intellectual property system as a competitive advance. Applications by residents rather than non-residents took the lead in China (88.8%), Japan (79.7%), South Korea (78.4%), Germany (69.2%) and Russia (65.7%). However, non-residents took the lead in Australia (91.8%), Canada (88.4%) and India (63.7%). A striking aspect is that the USA was the country that exported the most applications as a non-resident in other countries ( in 2019).
Regarding national and regional intellectual property offices, the trend has continued: 65% of applications worldwide were received by Asian offices whereas North America only received 20.4% and Europe 11.3%. Agencies in Latin America and the Caribbean, Africa and Oceania, combined, only received 3.3% of the total worldwide. Moreover, Latin America dropped from 2.8% in 2009 to just 1.7% in 2019.
The sector that dominated patent filing activity worldwide was “computer technology”, followed by electrical machinery, measurements, medical technology and digital communication. These five fields alone accounted for 28.4% of all published applications.
Other striking figures of the patent system were the number of patents finally granted in 2019: approximately 1.5 million (headed by China with 452,804). Similarly, approximately 15 million patents were in force in 2019 (headed by the U.S. with 3.1 million). Surprising only 18% remained in force for the full 20 years, whereas 42% were only in force for 7 years because to remain in force annual payments have to be made to the intellectual property offices.
The decisions adopted on patent applications were very varied depending on each country, for example in the case of Australia and Japan, approximately 75% were granted although in other countries such as China, the US and India only approximately 43% made it. Pending applications amounted to 5.4 million in 2019 (4% less than in 2018).
Patent applications using the PCT (Patent Cooperation Treaty) system, which allows applicants to seek patent protection simultaneously in different countries, increased by 5.2% in 2019, which is equivalent to 10 years’ continuous growth, headed once again by applications by residents in China.
Participation by women
Last but by no means least, the WIPI Report 2020 contains extremely important data: the participation by women in the patents system worldwide. At a PCT level, women accounted for just 18.7% of the inventors listed, although this reflects an increase from 11.8% in 2015. The gender gap varies considerably across countries; for example some countries reveal increasingly higher participation by women, such as China (32,4%), South Korea (27.4%) and Australia (19.9%), whereas countries with the lowest participation of women are Japan (10.7%), Germany (10.5%) and Austria (8.7%). Life sciences have a larger share of women inventors, specifically biotechnology, pharmaceuticals, etc.
In upcoming posts we will provide details of results and trends identified by the WIPI Report 2020 in relation to trademarks, industrial designs, geographical indications and the creative industry.
Garrigues Intellectual Property Department